What is the average cookie consent rate? EU benchmark 2026
 Małgorzata Poddębniak | 4 November 2026 | Last updated:
If you've looked at your consent rate and wondered whether it's good, you're not the only one. Almost every website in the EU runs a cookie banner, but very few teams know what a “normal” consent rate looks like. Most of them only ever see their own number and they have nothing to compare it to.
To give you that comparison, we analyzed 17.4 billion GA4 events from EU visitors on the TAGGRS platform between January and September 2026. This article shows what the average consent rate looks like, how it’s changing and how it differs by country, device and funnel stage. We also explain how to tell whether your own rate is healthy.
The figures cover visitors in the 27 EU member states, where cookie banners are most widespread. Outside Europe, consent is often not requested at all.
Key findings
- 68.8% of EU events include full consent. Use this as your benchmark.
- Full consent is dropping. It went from 71.3% in January to 65.2% in September 2026, and one in three events now arrives without it.
- Most of the drop isn’t visitors saying no. It comes from partial consent, missing choices and missing consent signals, which often point to setup issues you can fix.
- Consent is lower early in the funnel. Page views have less consent than purchases, so evaluate your setup by the events that matter for revenue.
- Visitors without consent spend about as much per order. Missing consent means missing revenue data.
- A higher rate isn’t automatically better. A very high rate can point to a pushy banner or consent granted by default.
Yet another consent report?
Several consent benchmarks already exist, mostly published by consent management platforms (CMPs). They’re useful, but they measure something different from what ends up in your marketing data.
CMP benchmarks count what visitors click in the banner, on the sites that use that particular CMP. For example, Didomi reports opt-in rates of 55.7% to 67.6% across European regions for 2025, measured against all banners shown. ConsentStack reports that on the median site among its customers, 72% of visitors who make a choice grant full consent. etracker puts the average in Germany between 40% and 54%, with the lower end on sites where the reject button is as visible as the accept button.
However, these reports can’t show whether the visitor’s choice actually reaches Google. A click on the banner doesn’t help if the consent signal isn’t passed on, if a tag fires before the consent update is processed, or if the event is sent without any consent signal.
Our data shows the consent state that is attached to each GA4 event when it reaches the server, which is what Google Analytics and Google Ads actually receive. That lets us show three things CMP reports can’t:
- All five consent states, including events denied by default and events sent without any consent signal
- How consent changes from page view to purchase, and how much revenue sits behind it
- Consent across websites using different consent platforms, based on 17.4 billion GA4 events from EU visitors
Because we count events rather than banner clicks, our numbers aren’t directly comparable to CMP benchmarks. Our denied-by-default share (8.0%), for example, is much lower than the 21.7% to 27.4% of visitors who make no choice in Didomi’s data. That’s because visitors who browse longer send more events and are more likely to have made a choice.
The five consent states
Consent isn't a simple yes or no. TAGGRS places every GA4 event in one of five consent states, based on two consent parameters that Google tags send with each event: gcs and gcd.
| Consent state | What it means |
| Not set | The event carried no consent signal at all. |
| Granted | All four signals were granted, either by default or because the visitor accepted. |
| Denied by default | Consent was set to denied by default and no choice from the visitor was recorded afterwards. |
| Denied | All four signals were denied, usually because the visitor declined. |
| Partially granted | Some consent types were granted and others weren’t. For example, the visitor accepted analytics cookies but declined advertising cookies. |
Keep two things in mind when you read the numbers:
- Granted doesn’t always mean the visitor accepted. If a site sets consent to granted before the visitor makes a choice, those events still count as granted.
- Denied by default has different causes than denied. Denied events come from visitors who declined. Denied by default can happen when a visitor ignores or closes the banner, leaves before making a choice or when the banner doesn’t load.
The consent information behind these five states comes from Google Consent Mode, which passes the visitor’s choices from the cookie banner to Google tags. The tags then include those choices with every event they send.
What is the average cookie consent rate in the EU?
The average cookie consent rate in the EU between January and September 2026 was 68.8%. That's the share of events from EU visitors with full consent. It was 71.3% in January and 65.2% in September.
In other words, roughly two in three events from EU visitors include full consent. If you also count partial consent, where visitors accept some categories but not others, 74.0% of events have at least some consent.
The Netherlands makes up almost half of the EU events in our data. Without it, the EU average is 67.2%, so the benchmark stays close either way.
This figure is the share of all GA4 events from EU visitors, so websites with more traffic have more influence on it than smaller ones. A typical website’s own rate can sit higher or lower than this average.
| Granted | Denied | Denied by default | Partially granted | Not set | |
| January 2026 | 71.29% | 13.89% | 6.89% | 4.35% | 3.58% |
| September 2026 | 65.15% | 12.58% | 9.65% | 7.39% | 5.23% |
| Jan–Sep 2026 average | 68.78% | 13.52% | 7.98% | 5.25% | 4.47% |
Source: TAGGRS platform data, GA4 events from EU-27 visitors that reached a server-side container.
How consent changed during 2026
Full consent in the EU dropped from 71.3% in January to 65.2% in September, a decrease of 6.1 percentage points in nine months. It stayed at around 71% in the first quarter and has gone down every month since March, with the decline speeding up in the second half of the year.
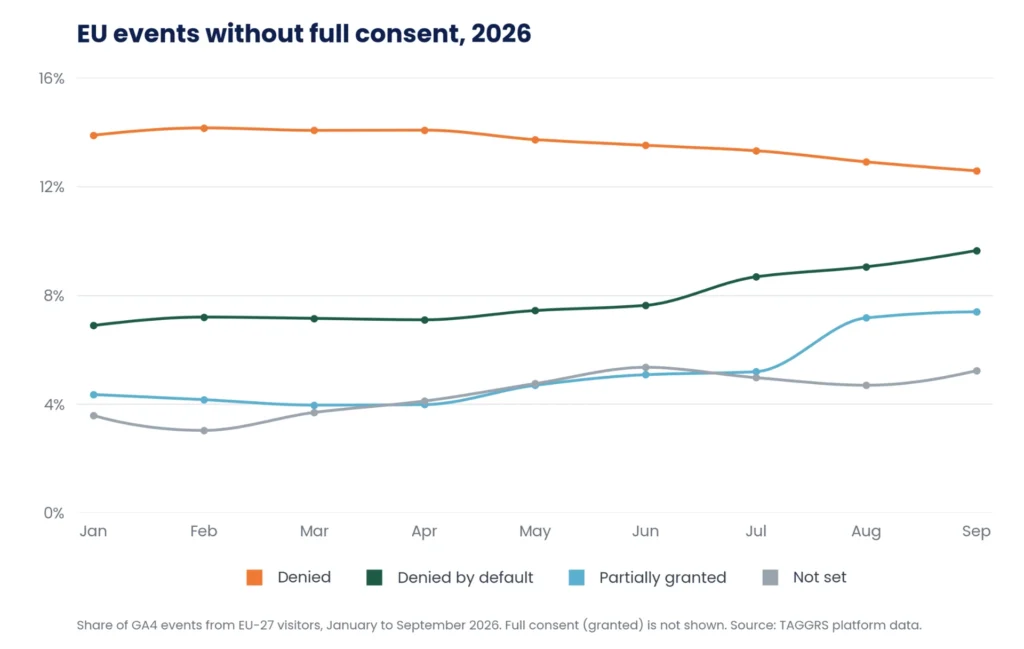
These nine months, based on 17.4 billion events, show a clear and consistent trend in 2026. We’ll keep tracking consent across the TAGGRS platform, so future editions of this benchmark will show how it develops in the coming years.
Active denial didn’t increase
When full consent drops, those events end up in one of the other consent states. Active denial wasn’t one of them. It went down slightly, from 13.9% in January to 12.6% in September. Instead, three other consent states increased:
- Partially granted went from 4.4% to 7.4%, an increase of 3.0 points.
- Denied by default went from 6.9% to 9.7%, an increase of 2.8 points.
- Not set went from 3.6% to 5.2%, an increase of 1.6 points.
The drop in full consent isn’t caused by more visitors declining. More events end up without full consent because:
- Visitors accept only some categories
- No consent selection is recorded
- The event is sent without a consent signal
The last two often come down to how the banner and tags are set up, so they should be checked first.
Denied by default is also getting closer to active denial. In January, active denial was twice as common as denied by default. By September, it was only 1.3 times as common (12.6% against 9.7%). If you combined the two into one “denied” figure, you wouldn’t see this shift, because their total barely changed (20.8% in January, 22.2% in September).
What this means for your tracking
Consent decides what data you can collect, so it’s worth optimizing. By September 2026, roughly one in three EU events arrived without full consent and that share grew every quarter. These figures only include events that reached a server-side container, so the real share is likely higher.
Here’s what you can do about it:
- Set up Consent Mode v2. It’s required to keep using Google’s advertising features in the EEA. In Advanced consent mode, Google tags still send limited, cookieless data when a visitor declines, so you keep some measurement for those visits. We explain the setup in our guide to Consent Mode v2.
- Build trust with a clear banner. A banner that gives visitors a real, balanced choice builds trust and keeps you on the right side of regulators. Our guide to consent rate optimization covers what to change.
- Make sure the banner works everywhere. Test it on different browsers and devices, and on your checkout pages. In our data, desktop and checkout events are more often denied by default or sent without a consent signal, which can point to a banner or tag that doesn’t work as intended.
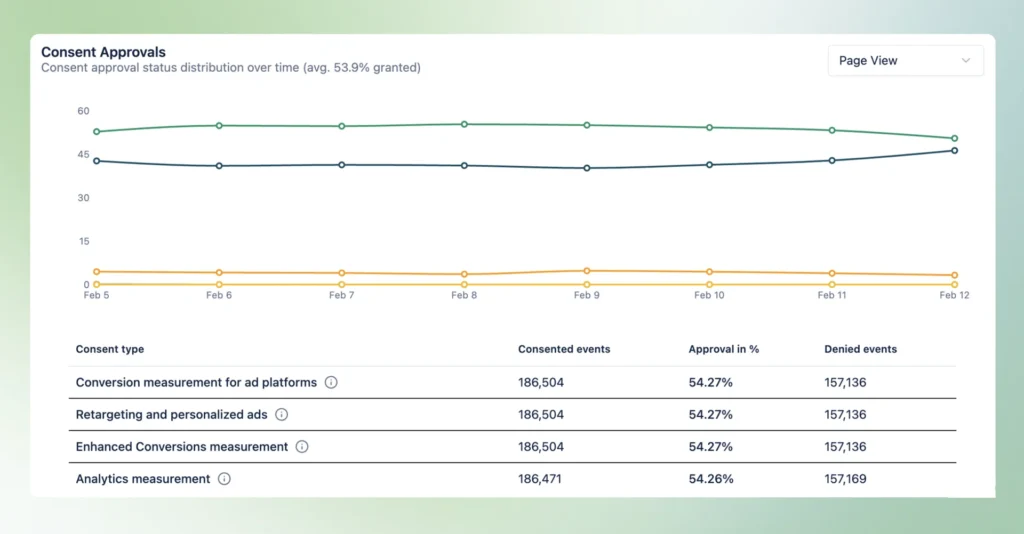
- Analyze your consent data. If you use TAGGRS, the Consent Approval Graph shows your own split per consent state and consent type. The Conversions by consent graph shows the conversions and revenue that are measured but don’t reach platforms like Google Ads in full.
- Control what each platform receives with Server-side Tracking. Server-side Tracking doesn’t raise your consent rate or change the choices visitors make in your banner. Instead, it lets you check each visitor’s consent in your server container, rather than in every separate tag on your website, before any data is sent to tools like GA4, Google Ads or Meta. That way, each platform only receives the data the visitor agreed to share. We cover how this works alongside a CMP like Axeptio in Beyond the banner.
How does the consent rate differ by country?
Full consent varies widely across the EU. Among the 16 EU countries with the most events in our data, it ranged from 50.7% in Romania to 96.3% in Lithuania. Germany (60.7%) was below the EU average and Belgium (74.4%) was above it.
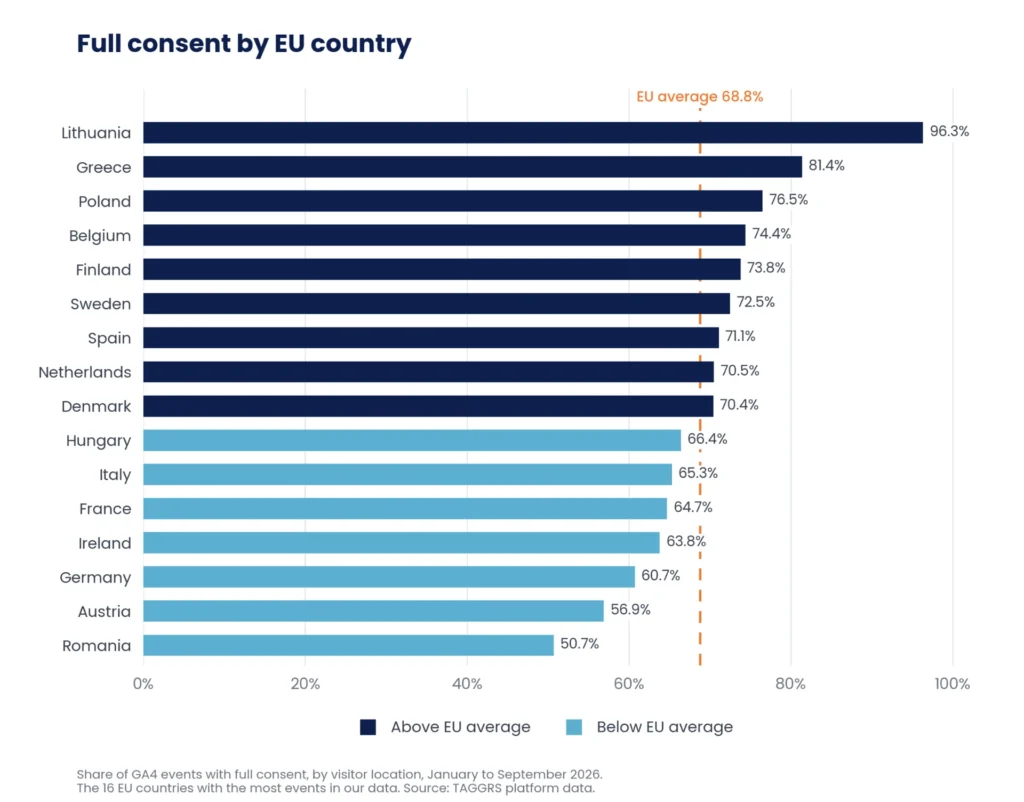
Most other EU markets in our data are somewhere in between, including Belgium (74.4%), Spain (71.1%), France (64.7%) and Italy (65.3%).
Lithuania stands out, with 96.3% full consent and only 2.1% of events denied. Such a high rate may come from a small number of large websites or from websites that set consent to granted before visitors make a choice. The data doesn’t tell us which. As we explain later in this article, a very high consent rate isn’t necessarily a good result.
Countries also differ in how the rest of their events are split:
- Active denial is highest in Italy (21.0%), Denmark (19.7%), Sweden (19.2%) and France (18.8%). Visitors in these countries more often decline consent in the cookie banner.
- Denied by default is highest in Romania (29.3%), Hungary (26.9%) and Ireland (20.9%). In these countries, a large share of events have no recorded consent choice.
- Not set is highest in Austria (22.1%) and Germany (10.7%). Many events in these countries are sent without a consent signal. This is more likely related to how consent is set up on the sites than to how visitors behave.
Part of this variation likely comes from national rules and enforcement. Each EU country has its own version of the cookie rules, and data protection authorities enforce them at a different pace. For example, the Dutch DPA has warned more than 200 organizations about misleading banners since 2025. Visitors in the Netherlands account for almost half of the EU events in our data, so changes on Dutch websites can also affect the EU average.
The country figures show where visitors were located and only cover websites that use TAGGRS. In smaller countries, a few large websites can have a big effect on the result.
How does the consent rate differ by device and browser?
Across all TAGGRS traffic worldwide, mobile visitors grant full consent more often than desktop visitors, 68.7% against 61.0%. Among browsers, Safari users grant full consent most often (71.4%) and Firefox users least often (59.3%).
These figures cover all TAGGRS traffic worldwide, not only visitors from the EU. About two-thirds of this traffic comes from EU visitors. The device and browser figures cover 14 February to 30 September 2026.
Most of the difference between mobile and desktop comes from events denied by default, which are almost twice as common on desktop (12.7%) as on mobile (7.4%). If most of your visitors use desktop, your consent rate is likely to be lower than the average.
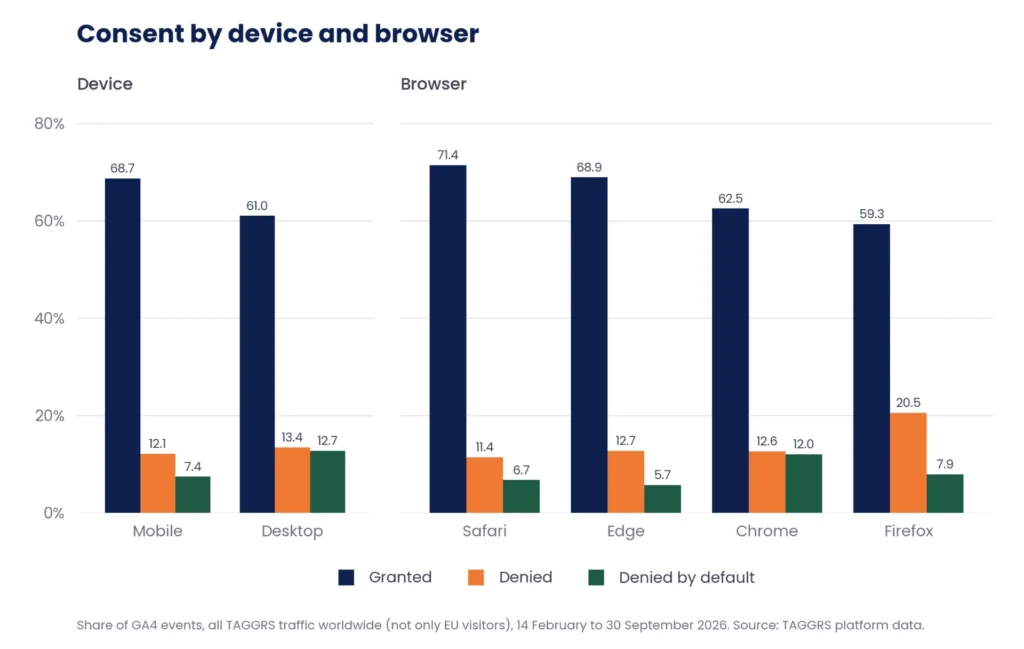
Chrome has a full consent rate of 62.5%, mostly because more of its events are denied by default (12.0%, against 6.7% on Safari). Firefox stands out for a different reason. One in five Firefox events (20.5%) was actively denied, compared to 11.4% on Safari.
Does the consent rate differ across the funnel?
Yes. Across all TAGGRS traffic worldwide, 60.7% of page view events included full consent, compared to 73.7% of purchase events.
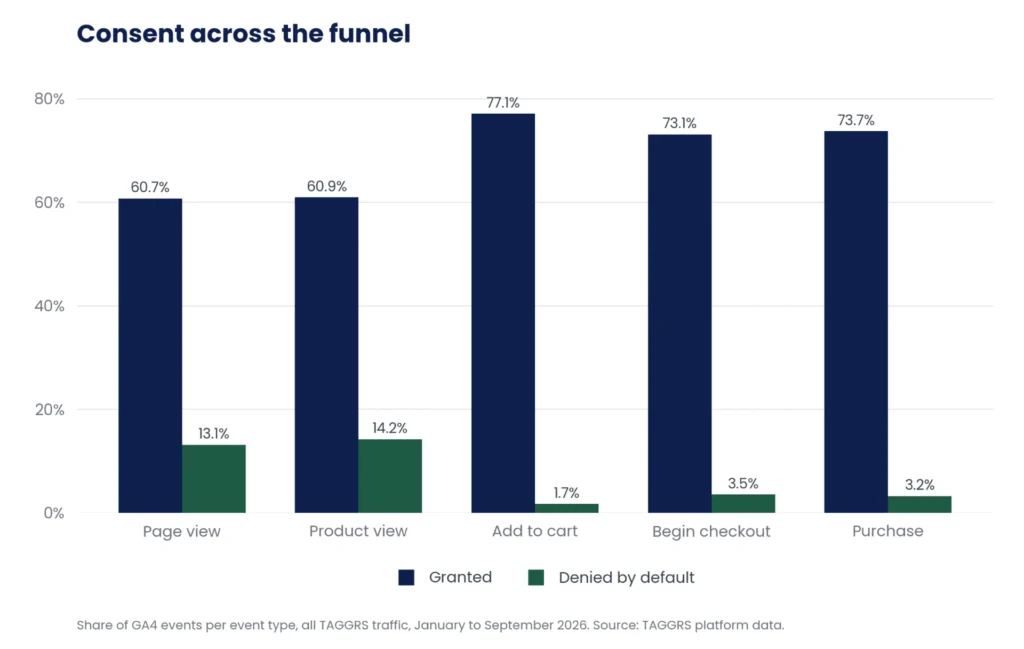
| Event | Granted | Denied | Denied by default | Not set |
| page_view | 60.7% | 13.7% | 13.1% | 7.4% |
| view_item | 60.9% | 15.3% | 14.2% | 3.8% |
| add_to_cart | 77.1% | 11.7% | 1.7% | 6.0% |
| begin_checkout | 73.1% | 10.3% | 3.5% | 10.9% |
| purchase | 73.7% | 10.4% | 3.2% | 9.3% |
| form_submit | 80.7% | 8.5% | 4.3% | 2.9% |
Source: TAGGRS platform data, all traffic worldwide (not only EU visitors), January to September 2026.
Most of this difference comes from events denied by default. They make up 13–14% of page view and product view events, but less than 4% of events from the add-to-cart step onwards. Active denial changes much less across the funnel. A likely explanation is that early events are often sent before the visitor has made a choice in the cookie banner. By the time someone adds a product to their basket, they have usually accepted or declined.
There are two more things worth knowing about the funnel.
- Checkout events are more often sent without a consent signal. Not set accounts for 10.9% of begin_checkout events and 9.3% of purchase events, compared to 3.8% of product view events. One possible reason is that checkout pages often run on a separate platform or template with its own consent setup. If that’s the case on your site, make sure those pages pass on the visitor’s consent signals too.
- Full consent on purchase events is declining. It went from 77.6% in Q1 to 73.6% in Q2 and 71.6% in Q3.
So if you judge your consent setup by page views alone, you’ll underestimate consent on the events that matter most for revenue.
If you use TAGGRS, you can check this for your own site. The Consent Approval Graph lets you filter by event type, such as view_item, add_to_cart or begin_checkout.
Do visitors without consent spend less?
No. In Q3 2026, purchases with consent fully denied made up 14.7% of all purchases with a recorded value, and 15.0% of revenue. On average, visitors without consent spend about as much per order as everyone else.
These figures cover all TAGGRS traffic worldwide, not only EU visitors. Here, purchases are grouped only by the gcs parameter, which shows whether ad_storage and analytics_storage were granted. We use Q3 because earlier in the year, some purchase events were sent without an order value.
This means the visitors you can’t fully measure aren’t lower-value customers.
The Conversions by consent graph in your dashboard shows the same split for your own site, by conversion volume and by conversion value.
Consent by type: Analytics vs advertising
Visitors accept analytics more often than advertising. Between January and September 2026, analytics_storage was granted on 70.2% of events, compared to 66.8% for ad_storage, 66.6% for ad_user_data and 65.9% for ad_personalization.
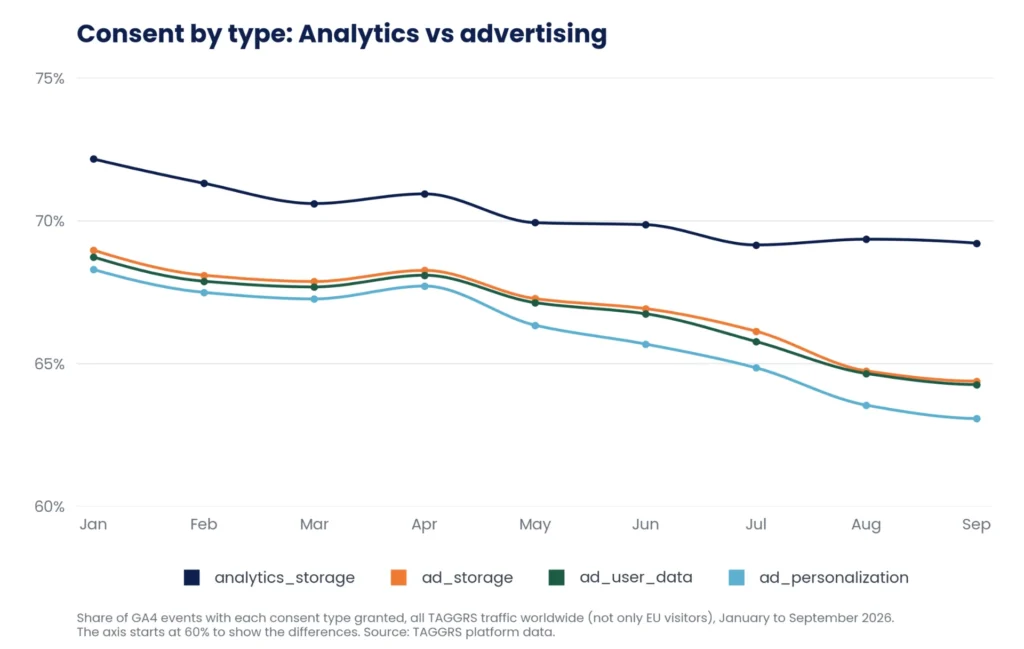
All four consent types declined during the year, but the advertising ones declined faster. The share of events with ad_personalization granted dropped from 68.3% in January to 63.1% in September, while analytics_storage went from 72.2% to 69.2%. This is relevant for advertisers, because ad_personalization controls whether visitors can be added to remarketing audiences and it’s the consent type granted least often.
These figures cover all TAGGRS traffic worldwide, not only EU visitors.
What is a good cookie consent rate?
A good consent rate isn’t simply the highest one. Use the 2026 EU average of 68.8% to see where you stand, and make sure a high rate comes from a clear banner that gives visitors a real choice.
A site can push its consent rate very high with a banner that makes accepting easy and declining difficult. The result looks impressive, but it’s a legal risk and can damage visitor trust. A banner that offers a balanced choice may lead to a lower rate and still be the better setup.
Cookie banners exist because of two pieces of EU law. Article 5(3) of the ePrivacy Directive requires websites to get consent before storing or reading information on a visitor’s device, unless doing so is strictly necessary to provide a service. The GDPR defines what valid consent looks like. It has to be freely given, specific, informed and unambiguous, and given through a clear action such as a click.
Regulators have been clear about this for years. At the end of 2021, the French data protection authority CNIL fined Google €150 million and Facebook €60 million because declining cookies took several clicks, while accepting took one. The European Data Protection Board (EDPB) has since confirmed that the option to decline has to be on the same layer as the option to accept. It also stated that pre-ticked boxes don’t count as valid consent.
In practice, declining should be as easy as accepting, usually with one click on the same layer of the banner. Nothing should be pre-ticked, and neither option should be styled to push visitors towards it.
Here’s how to read your own rate against the benchmark.
- Around 65–70%. Your rate is in line with the 2026 EU average. Keep in mind that the average is weighted by traffic, so it reflects larger websites more than smaller ones.
- Much higher. Check that the rate comes from a clear, compliant banner and that consent isn’t granted by default.
- Much lower. Look at how the rest of your events are split. A high denied rate means many visitors are actively declining. A high denied-by-default or not-set rate points more to how your banner or tags are set up, which you can often fix without changing what you ask visitors.
Also compare your rate with similar sites. Consent rates differ by country, device and funnel stage, so a website with mostly desktop visitors in Germany is likely to have a lower rate than a mobile-first site in Belgium.
How to check your own consent rate
You don’t need a full audit to see where you stand. These steps show how your own events split across consent states and where to start if something looks off:
- See your consent rate. If you use TAGGRS, open your dashboard. The Consent rate card shows the share of events sent with full consent in the selected period. The Consent Approval Graph shows how granted, denied by default and not set change over time. The table under the graph specifies the approval rate for each consent type. If you don’t have a TAGGRS account yet, you can create one for free. Many consent management platforms also show acceptance rates in their own reports.
- Check your setup. Run your website through our free website tracking checker. It checks whether your site has a consent banner and whether your tracking scripts follow the visitor’s choice. If your tracking scripts fire before the visitor gives consent, that’s a compliance risk. If your consent setup is stricter than it needs to be, you lose data you’re allowed to collect.
- Compare your numbers with the benchmark. Compare your Consent rate with the EU average of 68.8%, and check your denied-by-default and not-set shares too. If denied by default is well above 8% or not set is well above 4.5%, look at your setup first. You can use the filters in your dashboard to compare by device, browser or event, the same way we do in this article. Keep in mind that your dashboard includes all your visitors, while the benchmark only covers visitors from the EU.
- Look for sudden changes. A consent rate that’s stable for weeks and then drops on a specific date often lines up with a change to your banner or consent management platform. If one consent type has a much lower approval rate than the others, that usually points to a single consent category that isn’t set up correctly, rather than a site-wide problem.
- Fix technical issues first. Make sure the banner loads before your tags fire, that your tags wait for a consent signal, and that declining is as easy as accepting.
Your consent management platform and your TAGGRS dashboard may show different numbers. Your CMP counts clicks in the banner, while the Consent Approval Graph shows the consent state that’s actually sent to Google with each event. The two can differ if, for example, a tag fires before the consent update is processed.
What’s behind the numbers and what’s coming next
The data shows what changed, but not why. These are the most important factors that are playing a part:
- Stricter enforcement: Data protection authorities have started enforcing cookie rules more actively, like the Dutch DPA mentioned above. When a site changes a banner that previously made accepting easier than declining, more visitors are likely to decline, so the consent rate on that site goes down.
- Ad blockers hiding the banner: Some ad blockers block the cookie banner itself. The visitor never sees it, so they can’t make a choice, and consent stays at the site’s default setting. If that default is denied, the event is recorded as denied by default. Our data supports this. On sites where TAGGRS detects ad blockers, 25.0% of events from visitors with an ad blocker were denied by default in Q3, compared to 8.8% of events from other visitors.
- Consent decisions per category: Many cookie banners let visitors accept or decline each category separately, such as analytics and advertising. When more visitors use this option, or more sites offer it, partial consent goes up. This could explain why partial consent grew from 4.4% to 7.4% during the year.
- Bot traffic: Bots that load a page and run its tags don’t interact with the cookie banner, so their events keep the site’s default consent state. On sites that default to denied, these events are recorded as denied by default. If bot traffic, including automated AI agents, grew during the year, part of the rise in denied by default may come from bots, not users.
The legal framework behind cookie banners is also changing. At the moment, each EU country has its own version of the cookie rules, based on the ePrivacy Directive. The European Commission’s Digital Omnibus proposal would move them into the GDPR, so all 27 countries would follow the same requirements. It would also limit how often sites can ask visitors for consent again after they decline.
The proposal isn’t law yet. The Council agreed its negotiating position on 21 October 2026. Next steps involve negotiations with the European Parliament. If the Digital Omnibus passes, fewer repeat requests would mean fewer chances for visitors to change their mind and accept, which could lower consent rates further.
Help shape the State of Tracking Report 2027
This consent benchmark is part of our State of Tracking Report 2027, which looks at how much data marketers lose to consent, ad blockers and browser tracking prevention. To compare our platform data with what teams see day to day, we’re asking marketers about their own tracking.
Take our 5-minute survey and you’ll get:
- The full report before it goes public
- A chance to win a €200 Amazon voucher
- A benchmark to see how your tracking setup compares with industry peers
Methodology
What we measured: Every GA4 event from visitors in the 27 EU member states that reached a TAGGRS server-side container between 1 January and 30 September 2026, 17.4 billion events in total. The counts are exact and come from aggregate queries only, so no site, customer or visitor can be identified.
How we calculated it: Every percentage is a share of events, not visitors, and each event gets exactly one consent state, so the five states add up to 100%. Because of this, websites with more traffic have more influence on the averages than smaller ones. The headline benchmark and country figures cover EU visitors only. Device, browser, funnel, consent type and purchase figures cover all TAGGRS traffic worldwide, of which about two-thirds comes from the EU.
Google doesn’t publish an official list of the consent codes, so their meanings are based on consent platform documentation. About a fifth of events carry no location and aren’t included in the EU or country figures. For some sites, the recorded location can over-represent the Netherlands and Germany. Events from bots are not excluded, so some of the events in each consent state may come from automated traffic.
Does Server-side Tracking get around cookie consent?
No. Server-side Tracking doesn’t replace consent or change what visitors agree to. It lets you apply each visitor’s consent choice in your server container before any data is sent to tools like GA4, Google Ads or Meta.
Does Google Consent Mode increase your consent rate?
No. Consent Mode passes the visitor’s choice from your cookie banner to Google tags, but it doesn’t change the choice itself. In Advanced consent mode, Google tags still send limited, cookieless data when consent is denied, so you keep some measurement for those visits.
Does adding a “reject all” button lower your consent rate?
Usually, yes. etracker found that the average consent rate in Germany was around 40% on sites where the reject button is as visible as the accept button, compared with up to 54% on other sites. EU regulators expect the option to decline to be as easy as the option to accept, so a lower rate from a balanced banner is often the more compliant result.
Can I set consent to granted by default?
For non-essential cookies in the EU, this generally doesn’t meet the GDPR standard, which requires consent to be given through a clear action. The European Data Protection Board has also confirmed that pre-ticked boxes don’t count as valid consent. Check with your legal team for your specific setup.
How often should I check my consent rate?
Check it regularly, always after you change your cookie banner or consent management platform, or make changes to your website. A sudden drop on a specific date often points to one of these.
What is the average cookie consent rate in the EU?
Between January and September 2026, 68.8% of GA4 events from EU visitors on the TAGGRS platform included full consent, based on 17.4 billion events. The figure was 71.3% in January and 65.2% in September.